Example of Moderation
One of the clearest examples of moderation was presented by Cohen and Wills (1985). They argued that the social support literature (to that point in 1985) had neglected to consider the role of social support as a moderator of the stress to adjustment relationship. This moderation relationship is often depicted in the following way:
This schematic suggests that the relationship between stress and depression may differ in strength at different levels of social support. In other words, stress may be more strongly associated with depression under conditions of low social support compared to conditions of high social support. Most research had examined the main effect view of social support, namely, that the more social support that one engages in, the better one's adjustment (i.e. less depression). Cohen and Wills made the point that both the main effect and the interaction models should be examined, and they found evidence for both models in the literature.
To do this analysis, you will compute a hierarchical regression. The order of variables is as follows:
Thus, one will compute a hierarchical regression in which three distinct steps are stipulated. The main effect of stress is entered first, the main effect of social support is entered second, and the interaction term is entered third.
Let's consider some real data, and I'll take you through the process step-by-step. I happen to have some data where we can test Cohen and Wills' hypothesis. I collected in 2002 self-report data from 222 Asian New Zealand adolescents aged 10 to 20 years. In this data collection I obtained measures of stress, social support, and depression (from the Children's Depression Inventory). Subsequently in my dataset I created the interaction term of stress by social support by multiplying the two main effects.
Centering? A common question I get is: should I center the independent variable and the moderating variable before multiplying them together to create the interaction term? At this point in time, many researchers have gotten it drummed into them that they should center. Aiken and West (1991) recommended doing this procedure, and it has now become regular practice to do so. They hand-computed their equations, and centering yields the singular advantage of allowing the arithmetic operations to be performed more easily. They also mentioned the possibility of multicollinearity and 'non-essential ill-conditioning', both of which sound ominous. Kromrey and Foster-Johnson (1998), however, have pointed out that centering does not mitigate multicollinearity, so I (and lots of other people) are now recommending that centering is not necessary. You may wish to center in order to achieve a more interpretable metric on the x-axis, but most of the time I don't bother to do it.
So now I'm ready to do the statistical analysis. I entered depression (CDI) as my DV. I entered stress as the first predictor, socsup as my second predictor, and the interaction term as the third predictor. Before I run the analysis, I tick the R2change value box in ANALYSIS because this provides useful information. Below is the results box for coefficients. I find it the most useful for interpretation.
| | | Coefficientsa | | |
| | | 
| | |
| | | a. Dependent Variable: CDI(Depression) | | |
So how does one interpret these results? On the left side we see the three steps of the regression equation. On the first step, stress was entered. The obtained beta (.462) is like a Pearson correlation and can be interpreted in that fashion. The large and positive relationship tells me that Asian New Zealand adolescents who reported higher levels of stress also reported higher levels of depression. The second step shows that the main effect of social support was entered next. Stress is still in the equation, and the question is whether the new variable explains significant new variance in the DV. Is the beta for socsup statistically significant? Yes, it is. The negative beta indicates that higher social support is associated with lower depression, and this is what Cohen and Wills refers to as a main effect for social support. And finally, on the third step, did we find that the interaction term significantly added new variance (i.e., yielded a significant p-value)? Yes, it did.
We are now ready to confront a major issue in the interpretation of moderation: what does this last result tell us? Can one look at the beta of -.645 and conclude anything of value? The answer is no, one cannot. The interaction term requires graphing. If a researcher follows Aiken and West's suggestions, and this is what researchers have gotten into the habit of doing since their book came out, one sits down and generates the 9 cell means required for graphing the interaction. One trichotomizes both social support (high, medium, and low) and stress (high, medium, and low), and crosses these levels to obtain 9 cell means. "High" is typically defined as one standard deviation above the mean, "medium" is the mean, and "low" is one standard deviation below the mean. In order to derive these cell means, one embarks on a laborious and boring process of computing 9 separate lengthy algebraic equations. I won't take you through this process, but take my word for it, it's not a good use of your time and talents. Refer to Aiken and West's book (or my book) if you'd like to learn how to perform these calculations.
I noticed two things when I computed these cell means by hand: they take too long to do and I often made mistakes. I might spend 20-30 minutes computing these equations, and once I plotted them, I sometimes noticed that my lines were wonky (they weren't all straight). I'd have to go back and re-compute a particular equation or two to find the errors. This was far too time-consuming and frustrating for me. So I vowed to do something about it. I wrote ModGraph. This programme, if you're not familiar with it, enabled me to take the output from the SPSS box given above, and generate a manuscript-ready figure in 3-5 minutes. I was gratified by how quickly and accurately this could be done, and I thought that I should share this with the world. If you'd like to run immediately to this part of the web-site and try it out, please do so. If you don't know how to use it, stay here and read the following instructions.
You will need to have the mean and standard deviation of both main effects (stress and social support) as well as the unstandardized regression coefficients (the Bs from the third step/model in the box above). Be careful that you take the Bs from the third step alone, and not the betas. If you don't have the means and SDs, run a descriptive statistics computation and generate these numbers. The programme asks initially for labels, and you would enter the following:
Tittle:Moderation by Social Support
X-axis:Stress
Y-axis:Depression
Moderator:Social Support |
| B | Mean | SD |
Main Effect | .526 | 15.9865 | 14.23255 |
Moderating Effect | .037 | 21.5676 | 5.41762 |
Interaction Term | -.015 | | |
Constant | 6.733 | | |
Then you hit the "calculate" or "compute" button, and it will generate the 9 cell means and draw the figure. If you go to the figure you'll see something like this:
Moderation Chart
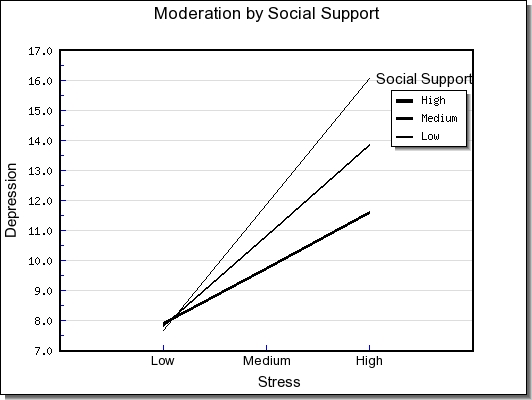
Depending on the version of ModGraph that you're using, you might have lines in colour, small fonts for the labels, the wrong metric on the y-axis, etc. If you are using the Excel version, then you can easily modify any undesirable effects. If you are using the web-site version, then you cannot modify the figure. I recommend using the web-site version for quick-and-dirty explorations, and then to move to the Excel version to generate the manuscript-ready figures.
Interpretation of the figure. I have found that one of the most difficult parts of the process of performing this type of analysis is to derive a clear and concise explanation of the obtained interaction. I will say a few things about this example, just to make it concrete, but you should be aware that interaction interpretation skill is something that must be developed with experience and expert tutelage. You can find a series of pages devoted to this topic in my mediation and moderation book.
The most straightforward way to make a moderation interpretation is to compare and contrast the slopes of the three lines. Notice in this case that the steepest slope (the strongest positive association) occurs for individuals who reported low social support. In contrast, the flattest slope (the weakest association) occurs for individuals who reported high social support. Now let's remember our hypothesis, or rather, Cohen and Wills' hypothesis: social support was expected to buffer the relationship between stress and depression. Did that happen? Yes, the weakest association between stress and depression occurred for teenagers who reported high social support. You can think of social support as a factor that weakens or diminishes the association between stress and negative affect (depression).
Aiken and West (1991) recommended computing the simple slopes of the three lines, and this too has been done by hand until recently. If you click on "simple slopes computation" in ModGraph, you will find a handy way to compute these values and quickly learn which of these lines are statistically significant from zero (in essence, which lines are not flat). Please refer to the instructions within ModGraph that tells one how to generate these values. The steepness of the slopes tells the user how strongly the IV and the DV are associated under conditions of the ModV and enable one to make an interpretation like the one in the previous paragraph.
After having said all of this, the reader may still have some residual confusion about this matter. I'm afraid that there is some inherent ambiguity in interpreting interactions, and it is always apparent when one makes an interpretation. The difficult part of the interpretation is to relate three different variables to each other (i.e., the independent variable, the moderator, and the dependent variable) all in one sentence. It's hard enough to relate two ideas or concepts at the same time--for example, "I tend to like new people I meet"--but it's even harder to relate three variables together at the same time--"I don't like everyone I meet for the first time when I'm in a bad mood, but when I'm in a good mood I like all new people I meet". The only real cure for this confusion, I've found, is to compute interactions yourself, and practice interpretations. In addition, read the literature and pay particular attention to authors who clearly present statistical interactions (i.e., with well-designed figures and graphs) and offer accurate and unambiguous interpretations of them. Practice, practice, practice.
|