Example of Mediation
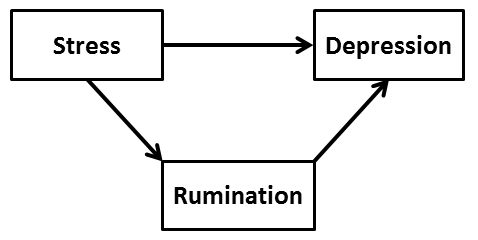
Another research interest of mine is the role of rumination on depression. Nolen-Hoeksema et al. (1993) have provocatively argued that rumination leads to greater depression, i.e., she has made a causal argument that an individual who ruminates more is likely to also feel more depressed. Notice that this is a simple two variable hypothesis: variable A causes variable B. I, on the other hand, wish to explore a more complicated scenario which builds on her idea; I am interested in determining whether rumination mediates the effect of stress upon depression. Notice that this hypothesis involves three variables. It would be depicted as below:

Let's see whether we can understand this conceptually before we tackle the statistical part. Let's begin with the basic relationship: IV to DV. I believe, on the basis of a lot of research and my own data, that stress is strongly predictive of reports of depression. I typically find a moderate positive correlation between these two variables, such as .35 or .40 (standardized beta). This result tells me that someone who reports a high level of stress in their life will also report a relatively higher level of depression. In short, we believe that experiencing stress in one's life causes one to become more depressed.
The inclusion of a mediator attempts to explicate the basic relationship between the independent variable and the dependent variable. When I argue that rumination may mediate the basic relationship, what I mean is that I think that stress leads one to ruminate more, and subsequently ruminating more leads one to feel more depressed. I have, in essence, proposed a mechanism or a route by which someone who is stressed becomes someone who is depressed. Rumination is not likely to be the entire route, but the mediation analysis will tell us whether rumination is a significant part of the process of moving from being stressed to being depressed. The identification of a mediator is a very helpful discovery because it elucidates the mechanism by which we get from point A to point C. Psychological models often include proposals of mediation (e.g., see Folkman and Lazarus's transactional model of coping), but as Holmbeck (1997) has pointed out, not all of these researchers have properly tested their hypotheses.
So how does one go about the statistical computations? The statistical technique behind mediation is very simple: correlation. In fact, the sheer simplicity of the computations has meant that many researchers have embarked on the journey of trying to find significant mediation. In my experience, however, some (many?) researchers have made mistakes because they failed to appreciate certain key issues surrounding mediation. Let me take you through the process of obtaining the necessary statistical output and how one would enter these bits of information into MedGraph, and then I will discuss some of the pitfalls involved with this method. I recommend that one conduct three separate statistical analyses in your basic software programme (such as SPSS):
1) compute raw correlations among the three variables in question;
2) compute a multiple regression where the mediator is the outcome and the IV is the predictor in the regression; and
3) compute a simultaneous inclusion multiple regression where the IV and the mediator are the predictors and the DV is the outcome in the regression.
These analyses will yield all of the statistical output necessary for proper computations within MedGraph. For effect size computations, I also ask for change in R2 values and partial correlations within the second regression.
Let's consider some real data now. I collected data from about 2,000 New Zealand adolescents in 2002 on various measures of stress, coping, and adjustment. The three measures that I'll choose to focus on here are the measures of stress, rumination, and depression. My hypothesis, again, was that rumination might act as a mediator between stress and depression. The raw correlations yielded the following results:
| |
Rumination |
Depression |
|
Stress |
.478 |
.471 |
|
Rumination |
|
.475 |
|
N = 1893 |
|
|
|
| |
1) The first regression (stress predicted rumination) yielded the following result: |
|
| |
B | .235 | |
| | se | .010 | |
| | 2) The second regression (stress and rumination predicted depression) yielded the last set of results: |
|
|
Rumination | |
| B | .334 |
| se | .023 |
| Beta | .321 |
| Part corr | .282 |
| Stress | |
| Beta | .320 |
| Part corr | .281 |
| Total R2 | |
| R2 | .304 |
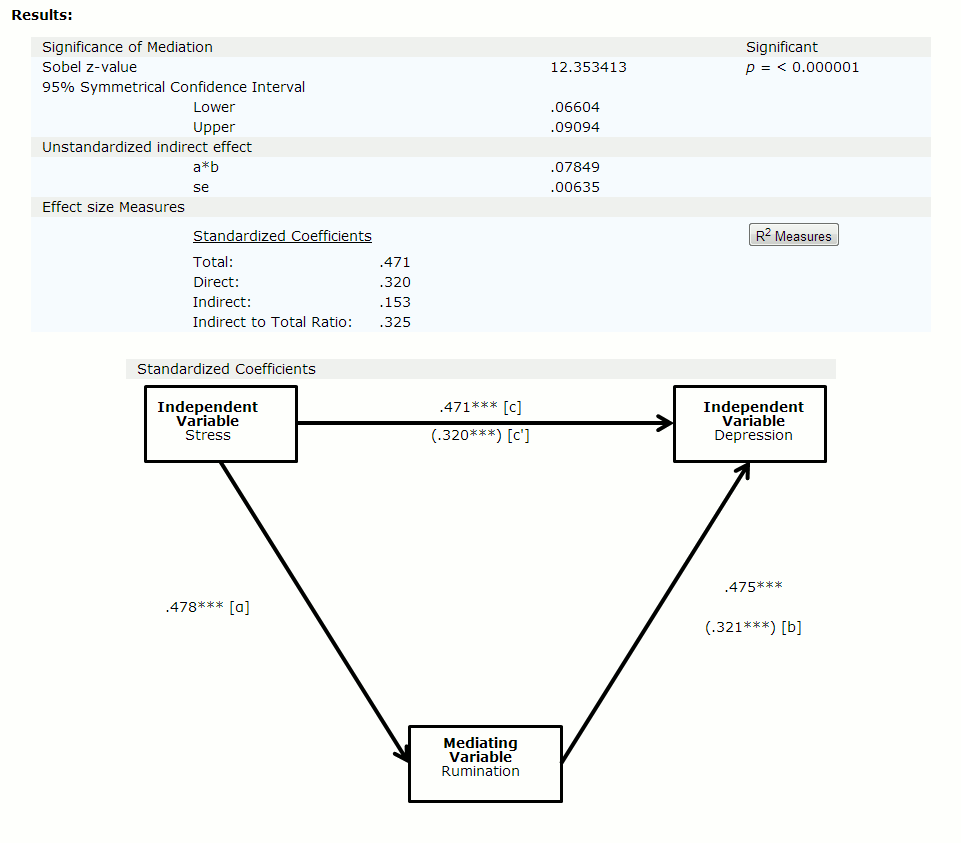
When you go to MedGraph and enter labels and statistical values, be careful to enter the correct values where requested. If you do so, then you should end up with a result like the following:

Interpretation
The Sobel's z-value must be sufficiently large, yielding a p-value of less than .05, and the 95% confidence interval must NOT include the value of zero in order for significant mediation to be identified. What this means in practice is that the association between the IV and the DV has been significantly reduced by the inclusion of the mediating variable in the second regression. One cannot just eyeball the change in betas (.471 to .320) and determine whether significant reduction has occurred. That is why the Sobel test and 95% CI are so valuable; they conclusively tell the user whether significant mediation has occurred or not. Incidentally, most statisticians are recommending these days that users report the 95% confidence interval instead of the Sobel’s z-value as the CI contains information about the variability (standard error) of the result. MedGraph provides both outcomes so you can choose what you wish to do.
The effect size measures tell the user how much of the effect of the IV on the DV can be attributed to the indirect path (IV to MV to DV). The total effect is the raw correlation between the IV and the DV. The direct effect is the size of the correlation between the IV and the DV with the mediating variable included in the regression. The indirect effect is the amount of the original correlation between the IV and the DV that now goes through the mediator to the DV (literally a*b where a refers to the path between the IV and the MedV and b refers to the path between the MedV and the DV). The last line reports a helpful ratio index that MacKinnon and others recommend that users report. The ratio is computed by dividing the indirect effect by the total effect, in this case it is .153/.471 = 33%. In this particular case, it seems that about one third of the total effect of the IV on the DV goes through the mediating variable, and about two thirds of the total effect is direct.
Most researchers report effect sizes based on standardized regression coefficients, and that is what I have described above. In addition, there are other effect sizes (about 6-8) that can be computed, and another one that I think is potentially useful is one based on partial correlations and R2 variances (see the box labelled "R2 measures"). If the user clicks on this box, this other effect size computation will be displayed. You will notice that it provides values that do not agree with the ones generated by the standardized regression coefficients. They are two different ways to estimate effect sizes, and we do not, as yet, have a consensus about which is optimal. Refer to MacKinnon’s (2008) and my (2013) books for discussions on this issue. I provide both here so that the user can decide for him/herself which he/she prefers.
And finally, I think that the user will find the figure that is generated of some value. Most mediation programmes do not bother with giving the user a graph or figure which contains both the original and the modified correlations. I think that it is very helpful to see the three variables in this figure and to see the correlations presented, with associated asterisks indicating degree of significance. In a quick glance, one can check that the inputs were correct and interpret the mediation results more clearly.
Dangers and drawbacks
1) The mechanics of computing the correlations and regressions, and transference of the correct information to the MedGraph programme (or some other programme) is not trivial and may lead to errors. Be very careful about how you conduct the analyses, and transfer information very carefully. One common snafu is that the user may not appreciate that results can be distorted if one has disproportionate missing data among the three variables. In other words, one might have a sample of 117 for the IV to mediator correlation, a sample of 146 for the mediator to DV correlation, and a sample of 139 for the IV to DV correlation. In other words, the correlations and associated regressions may be performed on different subsets of the entire sample, and the obtained values may not be performed on the same sample of participants. The safest approach would be to modify one's dataset to exclude individuals who yield missing data for one of these three variables at the outset, or one could conduct an appropriate imputation for the missing values.
2) One of my pet peeves about students who use mediation is that it generates a lot of fishing expeditions. By this I mean that users scan their data for clusters of three significantly intercorrelated variables, and then they run off to compute the Sobel's test. If it comes back non-significant, they try other variations until they find one that yields a significant result. This approach is fine for exploratory analyses when one does not have specific hypotheses, but results are often presented as though they were planned and inferential. Users should be aware that the best scientific method is to propose and test theoretically viable mediations, not just to report the ones that turn out to be significant.
3) Some users assume that a precondition for conducting mediation is that one must have significant correlations among all three variables. They think that if one correlation is NOT significant, that they CANNOT examine mediation in this triad of variables. This is not true. One can find significant mediation in cases where the zero-order IV to DV relationship (c path) is non-significant (see my book on this point). However, it must be said that if either of the other two paths (a or b) are non-significant, one is virtually assured of obtaining non-significant mediation.
4) One of the biggest problems is that users fail to appreciate that there are significant drawbacks to trying to identify mediation with concurrent data. For example, let's look at my mediation result above. One might triumphantly conclude from these results that stress causes rumination, which in turn causes depression. End of story, dum-ta-dum. Well, I'm not quite so enthusiastic because I realize that there are precisely five other mediation models that could be tested with these three variables in a concurrent dataset. Perhaps depression mediates the relationship between stress and rumination? Maybe stress mediates between rumination and depression? And so forth. I have examined all six of these mediational models with these data, and you know what? All six of these models yielded a result of significant mediation. The trouble with concurrent data is that one does not truly know the causal directions among one's variables. I suggest that the user collect longitudinal data to more accurately determine true mediation. Again, I have a long section on this issue in my book.
|